Debug your story
Print to the console
To print messages to the console use the debugPrint function which is part of
the Flutter SDK.
Widget myStory() {
   debugPrint('FOO');
   return MyWidget();
}
Your messages will appear on the terminal where you executed monarch run from.
You can call debugPrint from your stories or from your widget code.
Visual debugging
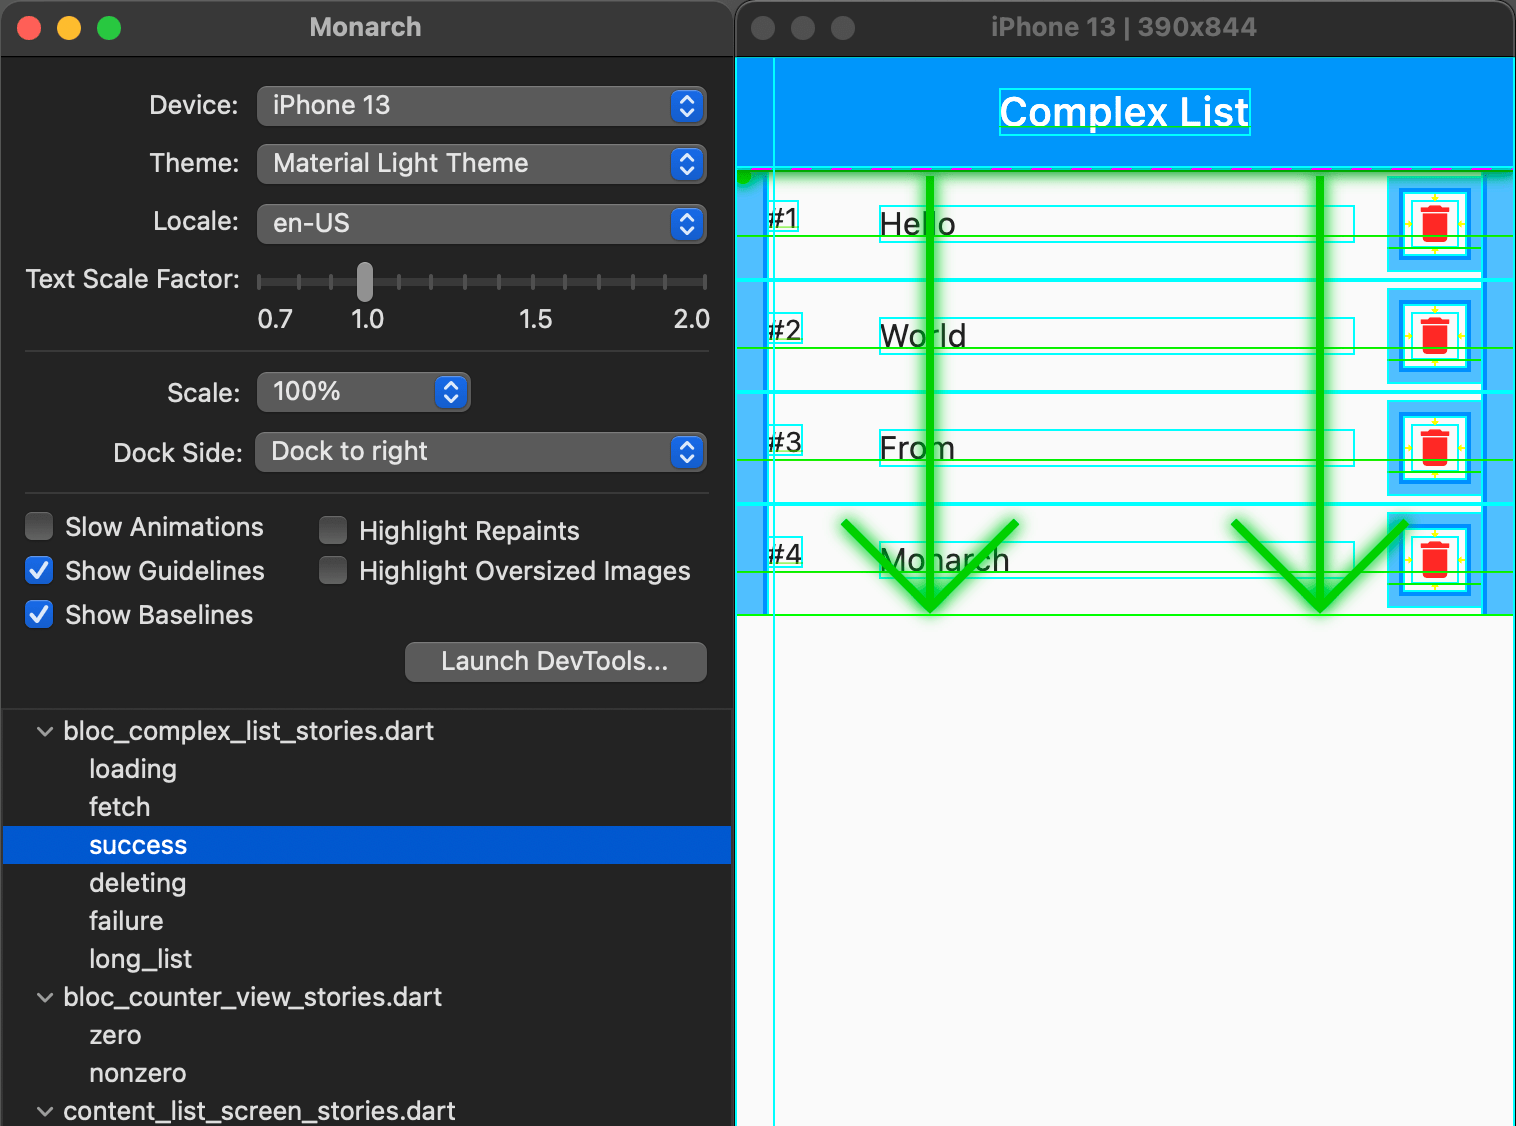
From Monarch you can enable several options to visually debug your stories:
- Slow animations: Run animations 5 times slower to help fine-tune them.
- Show guidelines: Overlay guidelines to assist with fixing layout issues.
- Show baselines: Show baselines which is useful for checking if text is aligned.
- Highlight repaints: Show borders that change color when elements repaint which is useful for finding unnecessary repaints.
- Highlight oversized images: Highlights images that are using too much memory by inverting colors and flipping them.
For more information, see Flutter's Visual Debugging documentation.
Launch DevTools
DevTools is a suite of performance and debugging tools provided by the Flutter team. You can launch DevTools from Monarch so you can further inspect, diagnose and debug your stories and widgets.
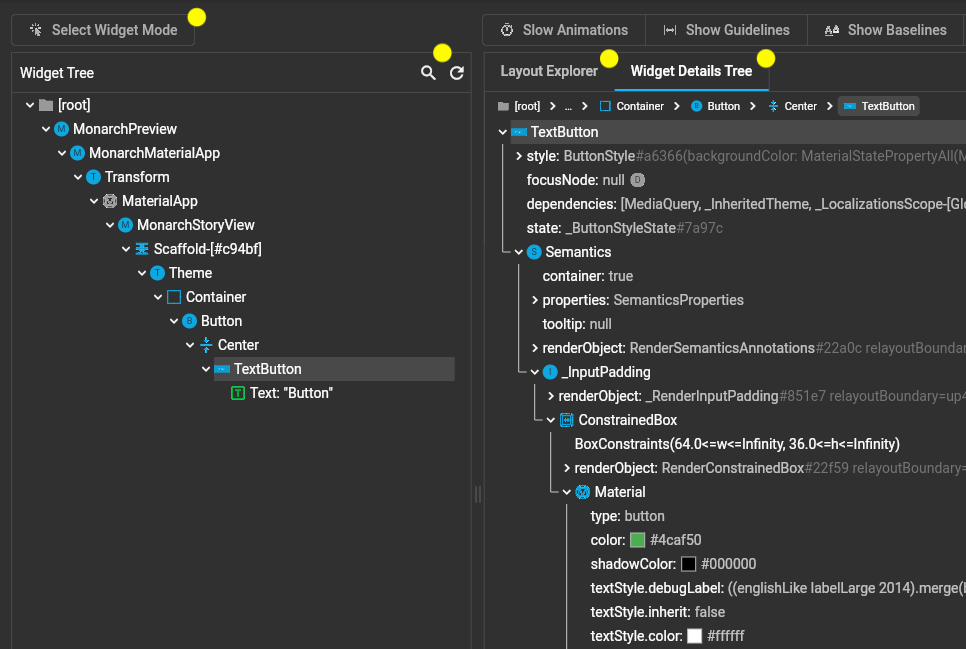
DevTools has many features you can explore to see how they affect your stories. The ones you may find most useful are "Select Widget Mode", "Widget Tree", "Layout Explorer" and the "Widget Details Tree".
After you click "Select Widget Mode", you can go to Monarch and select a widget on your story. You can then go to the "Widget Details Tree" to see useful information about the selected widget’s properties, render object, and children.
When you switch stories on Monarch, you have to hit the refresh icon on the Widget Tree to update the tree with the new story widgets.
Debug your widgets source code
With Monarch and DevTools you can debug your widgets source code in isolation, without running the full app.
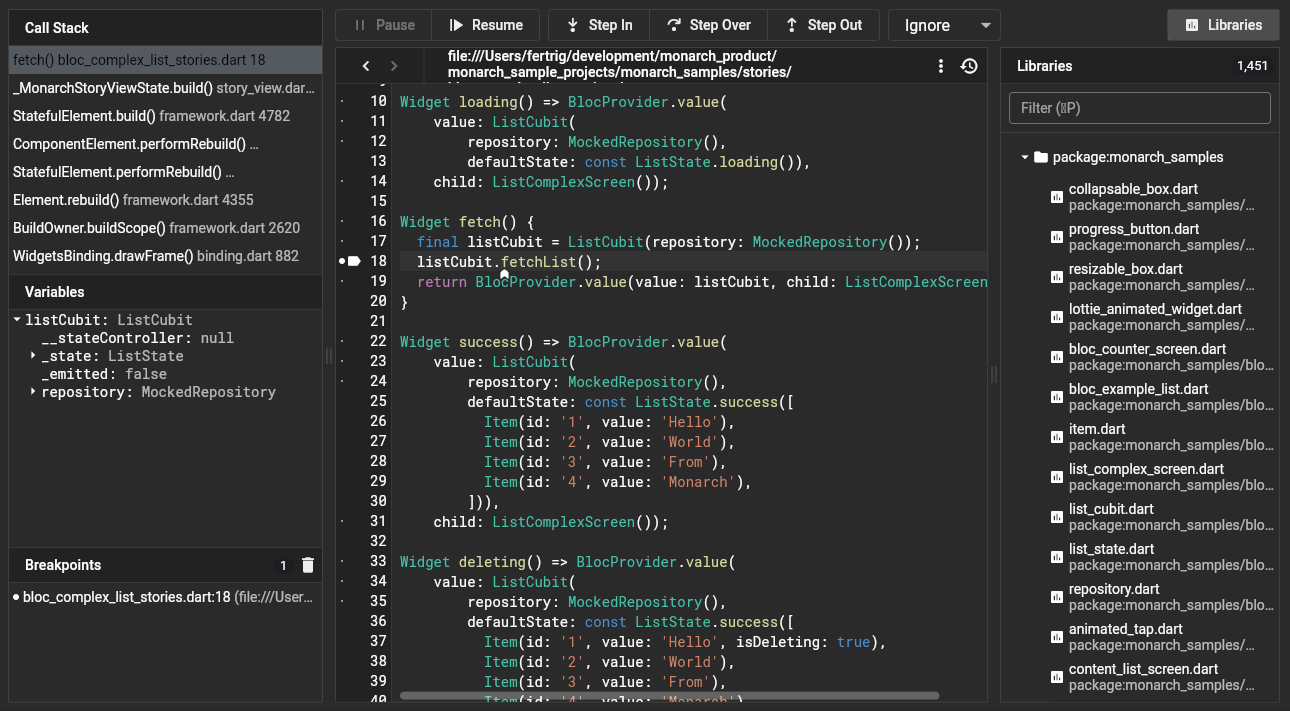
To debug a widget:
- From Monarch, launch DevTools.
- In DevTools, go to the Debugger tab.
- Click Libraries (top right) or use the hot key command
⌘ + Porctrl + P. - Search for your widget's source file or story source file.
- To set a breakpoint, click the left margin (the line number ruler) in the source area.
- Go to Monarch, and select a story that exercises the selected source file at the breakpoint location.
- The DevTools debugger will pause at your breakpoint.
- Now, you can inspect the call stack, variables and step through the code.
- Click Resume when you are done to let Monarch continue its normal operation.
For more information, see the DevTool's Debugger documentation.